Olympic Data Analysis Project Using Python
Olympic Data Analysis Project Using Python:
The Olympic Games have a rich history of showcasing athletic excellence and international collaboration. By analyzing Olympic data, we can uncover interesting trends, patterns, and insights about countries, athletes, and events. This project will focus on performing Olympic Data Analysis project using Python, covering all steps from data collection to visualization and analysis. Each step will be explained in detail with code and comments to make it easy to follow for beginners.
Objective:
- Collect and clean Olympic dataset for analysis.
- Explore data to understand trends and patterns in Olympic history.
- Visualize insights using advanced plotting techniques.
- Perform a complete analysis to answer key questions about Olympic performance.
- Click Here to Explore More From us
Dataset:
The dataset can be downloaded from Kaggle. It contains information about Olympic events, athletes, medals, and participating countries.
Tools & Libraries:
- Python
- Pandas
- NumPy
- Matplotlib
- Seaborn
- Jupyter Notebook or Google Colab (Recommended)
1. Data Collection & Setup
Import Libraries and Load Dataset
# Import necessary librariesimport pandas as pdimport numpy as npimport matplotlib.pyplot as pltimport seaborn as sns# Load the datasetdata = pd.read_csv('/path/to/olympic_data.csv') # Replace with actual file path# Preview the datasetdata.head()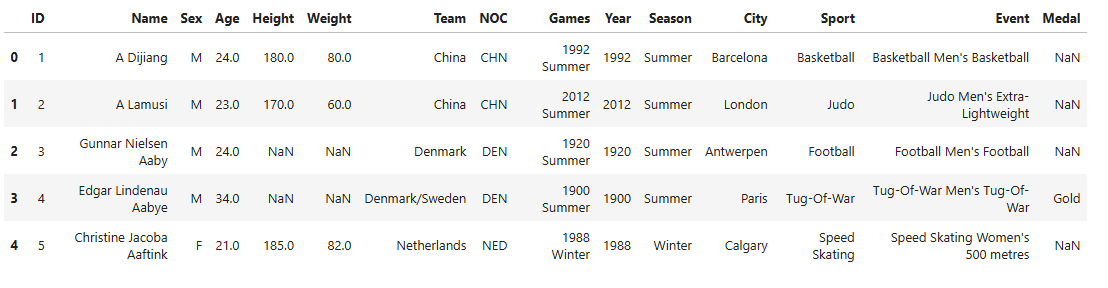
Explanation:
- The Olympic dataset is loaded using pandas, and the first few rows are displayed to get an overview of its structure. This helps us understand the columns and data types we’ll work with.
2. Exploratory Data Analysis (EDA)
Overview of the Dataset
# Display dataset informationdata.info()# Check for missing valuesdata.isnull().sum()# Basic statistical summarydata.describe()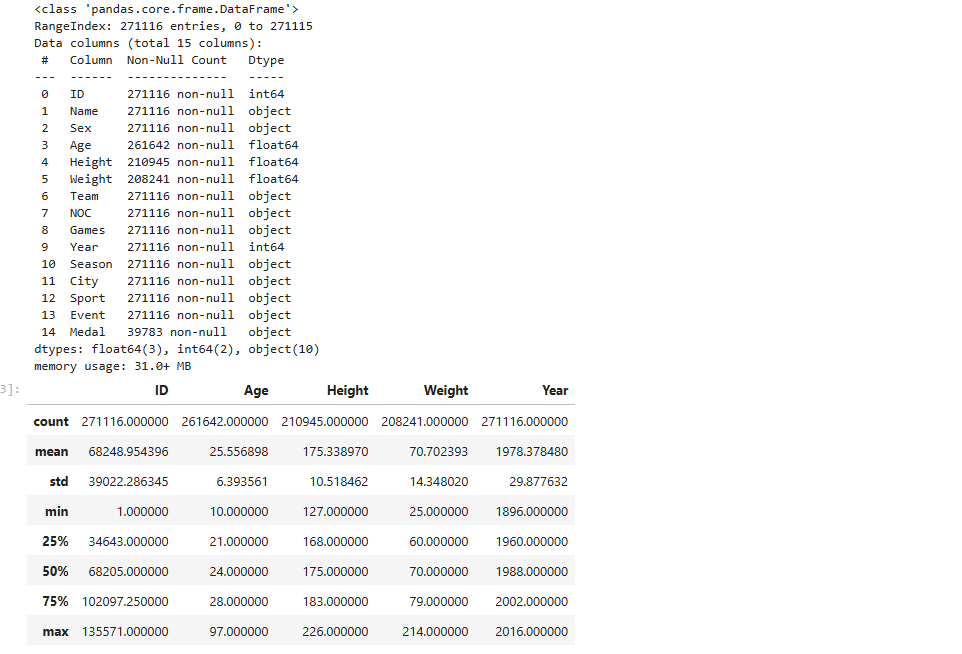
Explanation:
- We check for missing values and data types using
info()andisnull(). This step ensures we identify any inconsistencies or data cleaning needs. The statistical summary provides insights into numerical columns.
Top Countries by Medal Count
# Group data by countries and count medalscountry_medals = data.groupby('Country')['Medal'].count().sort_values(ascending=False).head(10)# Plot the top 10 countriesplt.figure(figsize=(10, 6))country_medals.plot(kind='bar', color='gold')plt.title('Top 10 Countries by Medal Count')plt.xlabel('Country')plt.ylabel('Number of Medals')plt.show()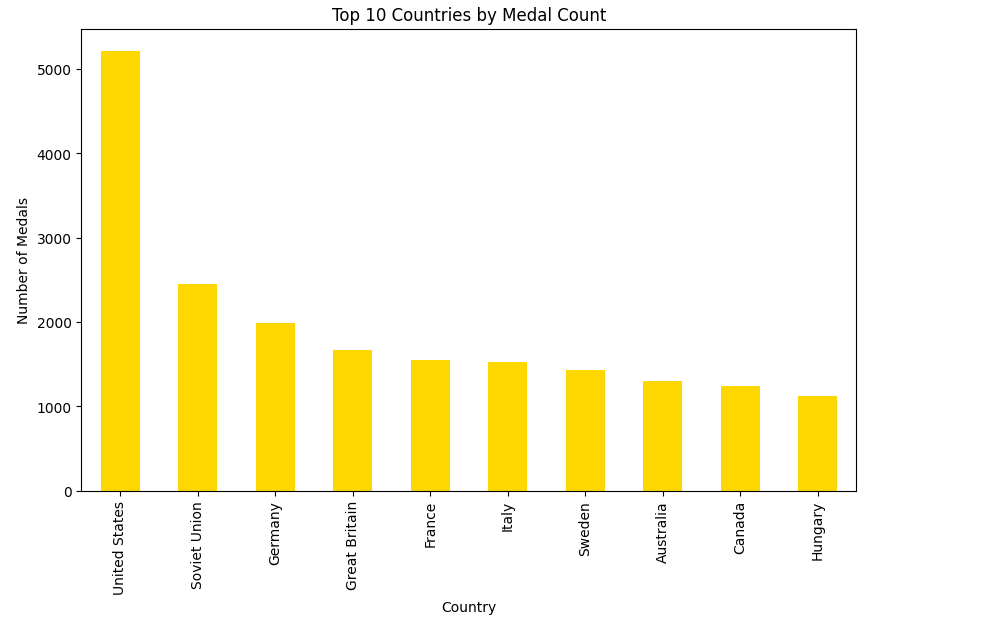
Explanation:
- This visualization highlights the countries with the highest medal counts, showing historical dominance in the Olympics. Grouping and sorting data helps us focus on the top-performing nations.
3. Data Cleaning & Preprocessing
Handle Missing Values
# Fill missing values in critical columnscolumns_to_fill = ['Medal', 'Age', 'Event']data[columns_to_fill] = data[columns_to_fill].fillna('Unknown')# Drop duplicatesdata.drop_duplicates(inplace=True)Explanation:
- Missing values are filled with placeholders to ensure data integrity. Dropping duplicates removes redundant records, improving dataset quality.
Feature Engineering
# Create a new column for medal type encodingmedal_mapping = {'Gold': 3, 'Silver': 2, 'Bronze': 1, 'Unknown': 0}data['Medal_Score'] = data['Medal'].map(medal_mapping)Explanation:
- Numerical encoding is applied to medal types to facilitate analysis and visualization. For instance, Gold is given the highest score (3) for significance.
4. Data Visualization
Medals Over Time
# Group data by year and count medalsyearly_medals = data.groupby('Year')['Medal'].count()# Plot medals over timeplt.figure(figsize=(12, 6))plt.plot(yearly_medals, marker='o', color='blue')plt.title('Total Medals Over Time')plt.xlabel('Year')plt.ylabel('Number of Medals')plt.grid()plt.show()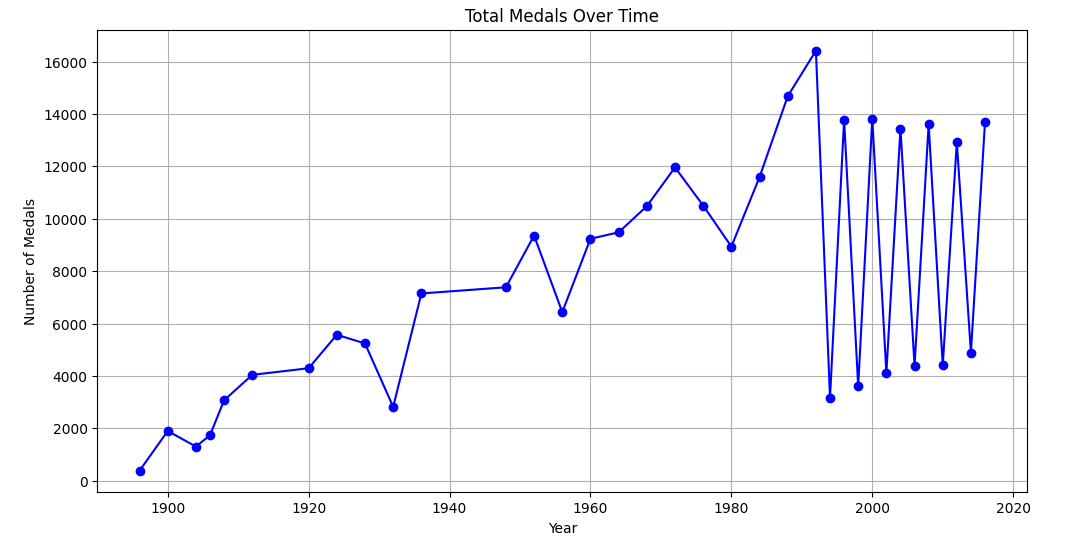
Explanation:
- This line plot shows how the number of medals has changed over the years. Significant spikes may correspond to specific events like the addition of new sports.
Gender Participation Analysis
# Group data by gendergender_participation = data['Gender'].value_counts()# Plot gender participationplt.figure(figsize=(8, 6))gender_participation.plot(kind='pie', autopct='%1.1f%%', colors=['blue', 'pink'], startangle=140)plt.title('Gender Participation in Olympics')plt.ylabel('')plt.show()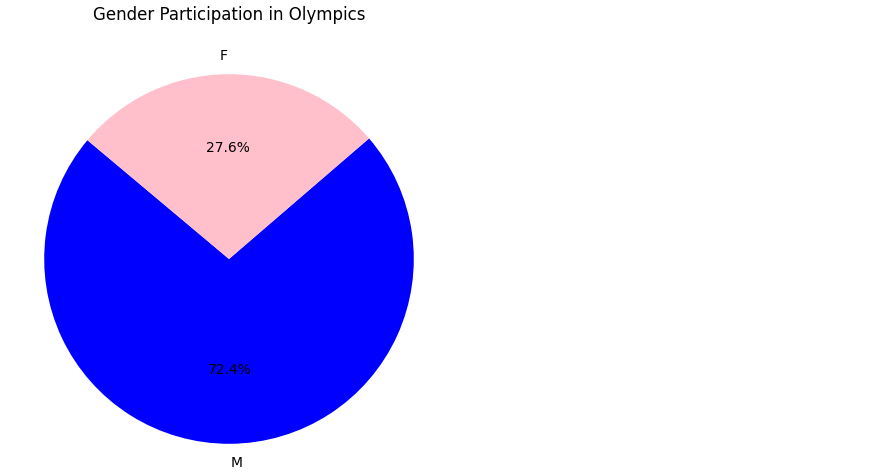
Explanation:
- A pie chart visualizes gender participation, providing insights into the representation of male and female athletes over the years.
Top Athletes by Medals
# Top athletes by total medalstop_athletes = data['Athlete'].value_counts().head(10)# Bar plot for top athletesplt.figure(figsize=(10, 6))top_athletes.plot(kind='bar', color='green')plt.title('Top 10 Athletes by Medals')plt.xlabel('Athlete')plt.ylabel('Number of Medals')plt.show()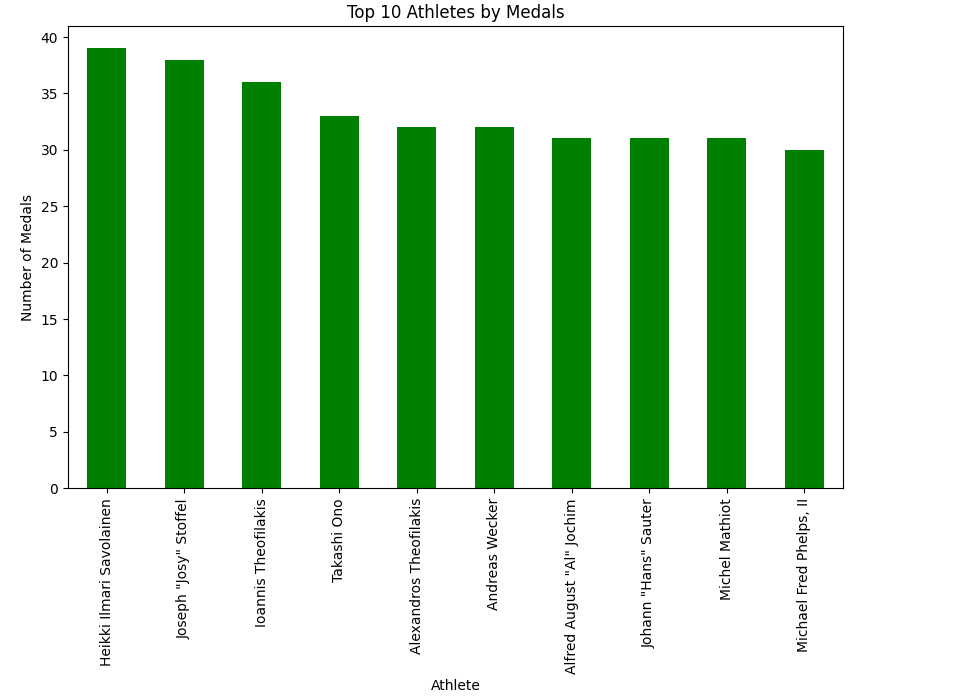
Explanation:
- This bar plot showcases the top athletes with the most medals, reflecting their dominance in Olympic history.
5. Complete Analysis
Key Questions and Answers:
- Which country has won the most medals overall?
- The country with the highest count in
country_medalsis the overall leader.
- The country with the highest count in
- How has participation evolved over time?
- The
yearly_medalsline plot demonstrates increasing participation, possibly due to new sports or events.
- The
- Who are the top-performing athletes?
- The
top_athletesbar plot identifies the most successful athletes based on medal counts.
- The
Additional Insights:
- Gender representation trends can reveal progress in achieving equity in sports.
- Analysis of medal scores can highlight countries excelling in high-value medals (Gold).
Summary:
This Olympic Data Analysis Project demonstrates how to preprocess, visualize, and analyze data to uncover trends and insights about Olympic history. From identifying top-performing countries to exploring gender representation and athlete performance, this project covers key aspects of Olympic analytics.
Download the dataset and expand the analysis by exploring specific sports or countries. Share your findings and take the first step in mastering data analysis projects!
Keywords: Olympic Data Analysis, Python Project, Data Visualization, Olympic Trends, Sports Analytics, Medal Analysis, Olympic Data Analysis Project Using Python, Olympic Data Analysis Project pdf