Credit Card Fraud Detection Using Machine Learning with Source Code
Credit Card Fraud Detection Using Machine Learning with Source Code – EDA and Model Building using Python.

Introduction:
Credit card fraud is a pressing issue in the digital age, costing businesses billions annually. Machine learning (ML) provides an effective way to detect fraudulent transactions by analyzing patterns in large datasets. This project on Credit Card Fraud Detection Using Machine Learning with Source Code covers exploratory data analysis (EDA), data preprocessing, and model development for classification. It is designed to guide beginners through building a fraud detection model step by step.
Objective:
- Perform exploratory data analysis (EDA) on a credit card fraud detection dataset.
- Preprocess and clean the data for model training.
- Build and evaluate machine learning models to detect fraudulent transactions.
- Provided complete source code to allow easy project replication.
Dataset:
The dataset used in this project is available on Kaggle. Download the ‘creditcard.csv’ file for analysis. This dataset contains transactions made by credit cards in September 2013 by European cardholders.
Tools & Libraries:
- Python
- Pandas
- NumPy
- Matplotlib
- Seaborn
- Scikit-learn
- Jupyter Notebook or Google Colab (Recommended)
Instructions:
- Use Jupyter Notebook or Google Colab for smooth execution.
- Copy the provided code into cells and run each section step by step.
- Detailed explanations are included to help users learn from the project.
- You Can also Download the ipynb file and the dataset for this project from this Link.
Implementation Steps:
1. Data Collection & Setup
Import necessary libraries and load the dataset.
import pandas as pd
import numpy as np
import matplotlib.pyplot as plt
import seaborn as sns
from sklearn.model_selection import train_test_split
from sklearn.ensemble import RandomForestClassifier
from sklearn.metrics import classification_report, confusion_matrix, accuracy_score
%matplotlib inline
# Load the dataset
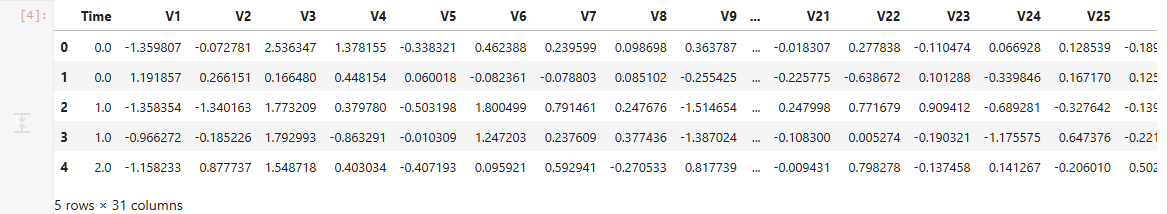
data = pd.read_csv('/path/to/creditcard.csv') # Replace with the actual path
data.head()
- Explanation:
- Essential libraries for data manipulation and visualization are imported.
- The dataset is loaded, and the first few rows are displayed.
2. Data Exploration
Understand the structure of the dataset.
data.info()
data.describe()
data.columns
data.isnull().sum()
data['Class'].value_counts()
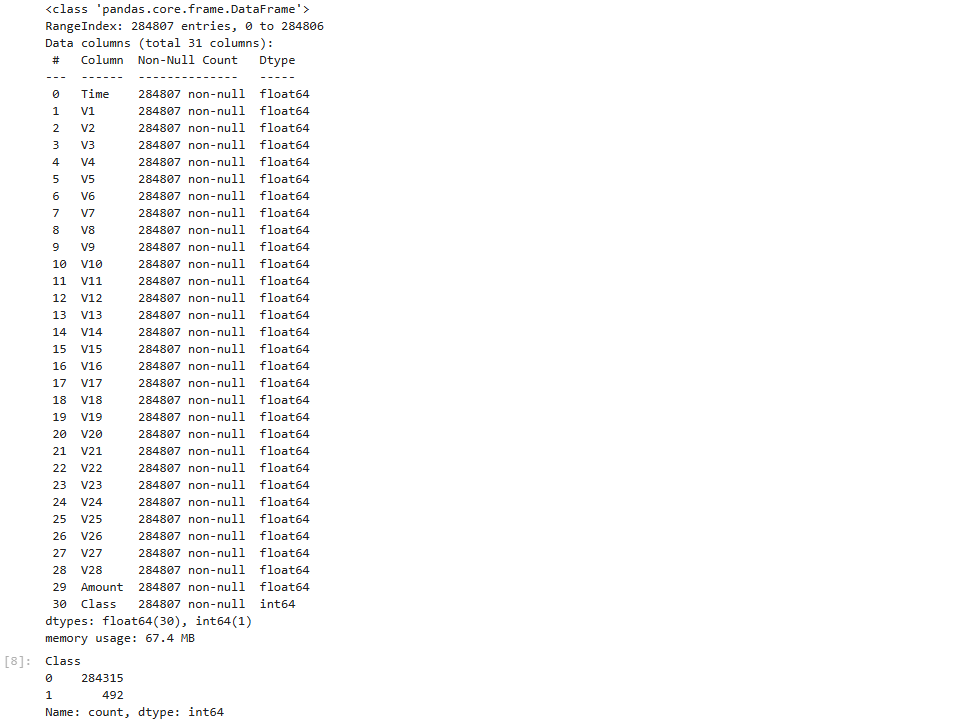
- Explanation:
info()anddescribe()provide insights into data types and summary statistics.- Checking class distribution helps understand class imbalance.
3. Exploratory Data Analysis (EDA)
import matplotlib.pyplot as plt
import seaborn as sns
# Distribution of classes
sns.countplot(x='Class', data=data)
plt.title('Class Distribution')
plt.show()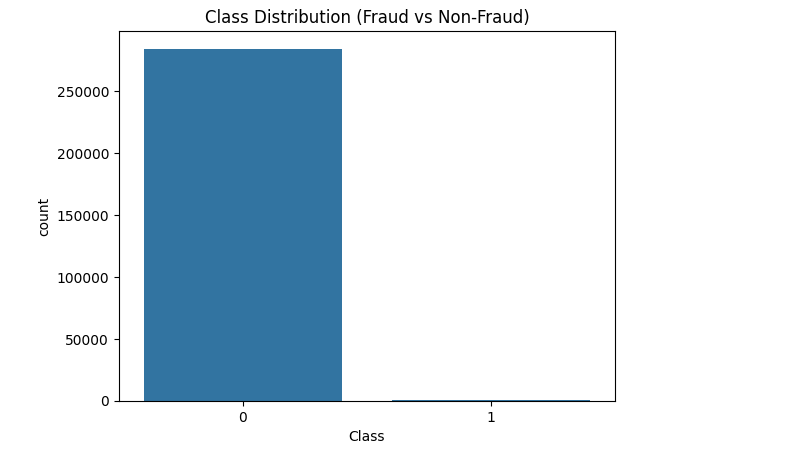
# Visualize amount vs time
sns.scatterplot(x='Time', y='Amount', hue='Class', data=data)
plt.title('Transaction Amount vs Time')
plt.show()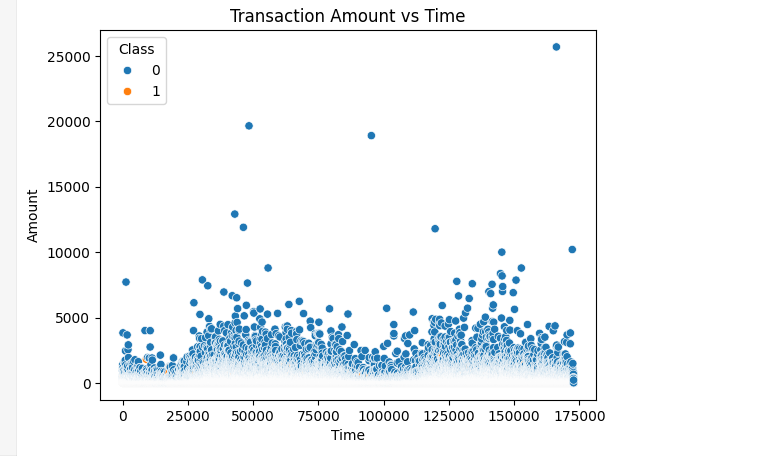
# Plot the distribution of transaction amounts
plt.figure(figsize=(10, 6))
sns.histplot(data['Amount'], bins=50, kde=True)
plt.title('Distribution of Transaction Amounts')
plt.show()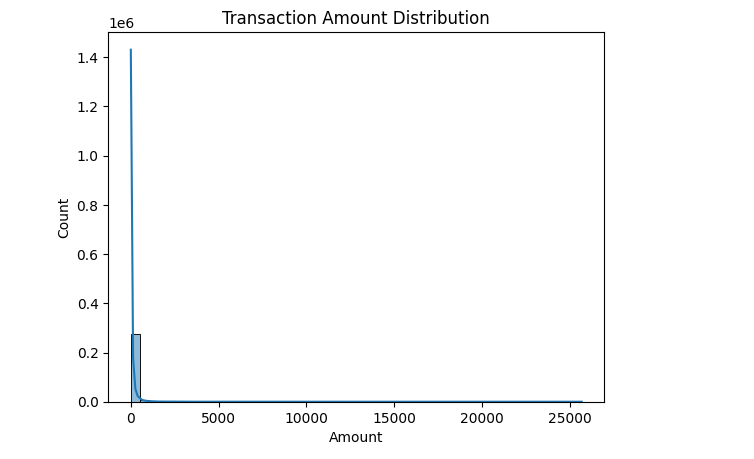
# Visualize the correlation between features
plt.figure(figsize=(12, 8))
correlation_matrix = data.corr()
sns.heatmap(correlation_matrix, annot=True, cmap='coolwarm')
plt.title('Feature Correlation Matrix')
plt.show()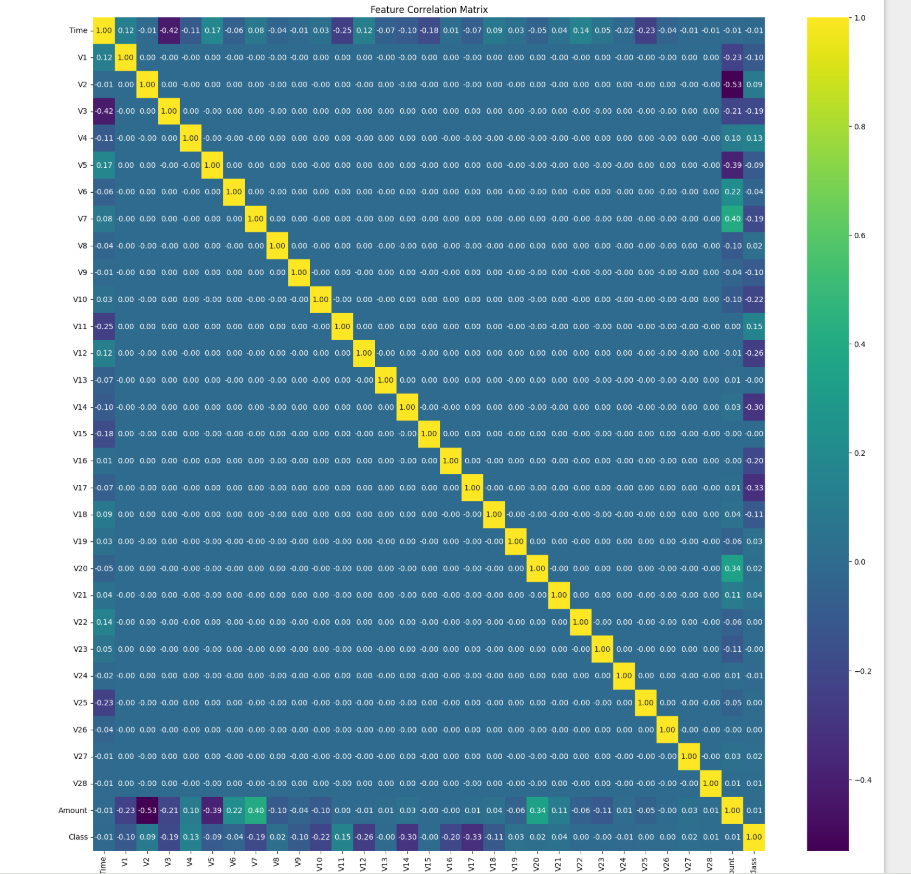
Explanation:
- Class distribution shows the imbalance between fraudulent and legitimate transactions.
- Scatter plot visualizes transaction amounts over time, colored by class.
- A histogram visualizes the distribution of transaction amounts.
- The heatmap provides insights into feature correlations.
4. Data Visualization
Class Distribution
sns.countplot(x='Class', data=data)
plt.title('Class Distribution (Fraud vs Non-Fraud)')
plt.show()
- Explanation:
- Visualizing class imbalance highlights the need for resampling techniques.
Transaction Amount Distribution
sns.histplot(data['Amount'], bins=50, kde=True)
plt.title('Transaction Amount Distribution')
plt.show()
- Explanation:
- Analyzing the transaction amount can reveal outliers and patterns.
Correlation Heatmap
plt.figure(figsize=(10,8))
sns.heatmap(data.corr(), annot=False, cmap='coolwarm')
plt.title('Feature Correlation Heatmap')
plt.show()
- Explanation:
- Correlation heatmaps show relationships between features, aiding feature selection.
5. Data Preprocessing
Prepare the data for model training.
from sklearn.preprocessing import StandardScaler

# Scale Amount and Time columns
data['Amount'] = StandardScaler().fit_transform(data['Amount'].values.reshape(-1,1))
data['Time'] = StandardScaler().fit_transform(data['Time'].values.reshape(-1,1))

# Separate features and target
X = data.drop('Class', axis=1)
y = data['Class']

# Train-test split
X_train, X_test, y_train, y_test = train_test_split(X, y, test_size=0.2, random_state=42)
- Explanation:
StandardScalerstandardizesAmountandTimefor better model performance.- The dataset is split into training and testing sets.
6. Model Building
Train a Random Forest Classifier to detect fraud.
model = RandomForestClassifier(n_estimators=100, random_state=42)
model.fit(X_train, y_train)

# Model prediction
y_pred = model.predict(X_test)

# Evaluate the model
print(confusion_matrix(y_test, y_pred))
print(classification_report(y_test, y_pred))
print(f'Accuracy: {accuracy_score(y_test, y_pred)*100:.2f}%')
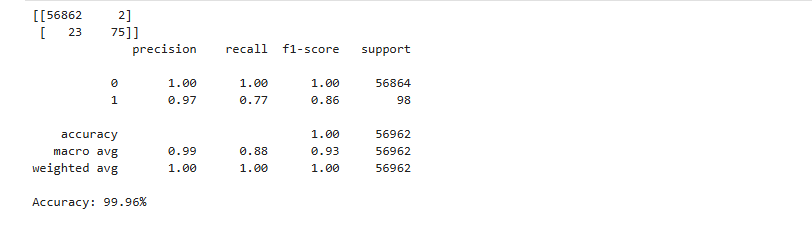
- Explanation:
- A Random Forest Classifier is trained and evaluated.
- The confusion matrix, classification report, and accuracy score assess performance.
7. Handling Class Imbalance
Apply oversampling to address imbalance.
from imblearn.over_sampling import SMOTE
smote = SMOTE(random_state=42)
X_resampled, y_resampled = smote.fit_resample(X_train, y_train)
model.fit(X_resampled, y_resampled)
y_pred_resampled = model.predict(X_test)
print(classification_report(y_test, y_pred_resampled))
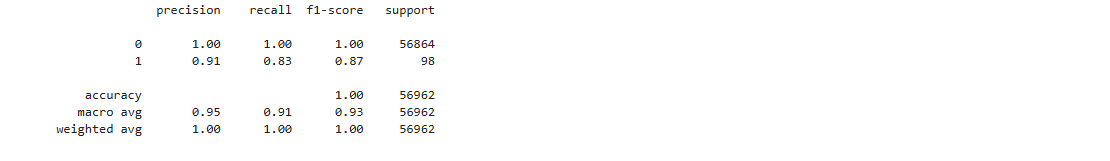
- Explanation:
SMOTE(Synthetic Minority Over-sampling Technique) generates synthetic data for the minority class, improving model performance.
8. Conclusion
This project on Credit Card Fraud Detection Using Machine Learning with Source Code demonstrates how machine learning can effectively detect fraudulent transactions. Through EDA, data preprocessing, and model training, valuable insights were derived, and a classification model was developed. This hands-on project enhances data science and machine learning skills by applying real-world datasets.
Download the dataset and enhance the project by trying different models or hyperparameter tuning. This is a great way to sharpen your ML skills while working on real-world data.
Keywords: Credit Card Fraud Detection Using Machine Learning with Source Code, Fraud Detection EDA, Python Data Science Project, ML Classification Project.